How to Enhance Your Website Using Heatmaps

In an increasingly competitive marketplace, B2B technology companies want their messaging to stand out among the rest. One of the first areas to focus these efforts is optimizing your company’s website. But how can you determine which website features your prospects and customers are being drawn to the most in order to enhance and improve?
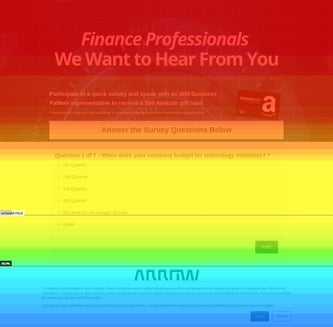
Heatmaps are helpful marketing visualization tools that record the screen activity of visitors on your website and can provide information such as what they clicked on and looked at. The output displays the most-used parts of the page in dark red, with less-viewed areas showing up as cooler hues, such as blue and purple. Heatmaps can help you understand how visitors navigate your site as well as identify areas that are causing frustration, leading to a more positive user experience. With fewer distractions, visitors are more likely to take the desired action you want them to take and convert on your website.
We sat down with TSL’s Marketing Automation & Analytics Manager, Ines McNeil, and discussed the use of heatmaps and the multiple benefits of this helpful web analytics tool.
How often are heatmaps used in B2B marketing?
Ines: Pretty frequently. You want to make sure people are using your website as expected. If there are issues, such as people not scrolling down to see the important information you want them to see, you want to be able to fix it.
TSL Marketing uses these results as a basis for optimizing our clients’ online content.
How can heatmap results benefit a B2B company’s marketing strategy?
Ines: Heatmaps can be used for driving results. If you are paying for SEO and visitors are reaching your pages but not converting, or they are consuming the information you want them to consume but not converting on the form on the page for one reason or another, you need to fix that. You're spending money to get traffic to your website, but you (and your visitors) are not getting what you want out of it. Heatmaps are critical to uncovering how people are navigating your page so you can best optimize it.
Heatmaps also help you generate content that is relevant to users: what exactly are visitors looking at the longest? You now have a better idea of what topics they're interested in, which then helps you to create even more content in those same interest areas.
In another example, sometimes a company’s marketing executives want all kinds of content on a homepage. Heatmaps can prove that visitors are not going to scroll down the whole page to see everything. This helps facilitate a conversation — with data on hand — to provide recommendations.
During the redesign phase of Agile continuous improvement, heatmaps can help designers know where to place things and dictate which content should be prioritized above the fold.
What are the different heatmaps that TSL uses in helping understand web users’ behavior? How can these results be incorporated to improve marketing efforts?
Ines: At TSL, we use three different types of heatmaps:
- With click-tracking heatmaps, we can measure items such as what portion of the page is receiving the greatest number of clicks, which buttons are getting clicked, whether the CTA is engaging enough, which links are performing, etc. The results are broken down by the number of clicks as well as percentage (i.e. 80% of clicks on a page out of the percentage of total clicks), which helps you compare the performance of something like a button vs. hyperlinked text. When you understand clicks, you can see which of your content topics are important to users and what is grabbing their attention. Results — which can sometimes be surprising or unexpected — can lead to tweaking the design to give higher priority content pieces more attention.
- Mouse-tracking heatmaps show you how visitors are navigating the page, which can be very similar to eye-tracking. Often, visitors will click and move the mouse along with what they are reading, so we can see what sections of the page they’re paying attention to when we watch where their mouse goes. Like the click-tracking model, you can see what is grabbing attention, whether that is a particular content topic or design.
- Scroll maps analyze the performance of your page above and below the fold. Results reveal which parts of the page users are seeing the most vs. what percentage continue to scroll down and view the rest of the page. Our results have shown that the percentage of users drops off as readers scroll down, from 96% (top of the page) to 77% (right above the fold) to 60% (below the fold) to 33% (bottom of page). What this tells us is that we need to prioritize the most important material and information at the top of the page.
TSL uses Hotjar for heatmap assessments. What is it and why does it come so highly recommended?
Ines: Hotjar allows each of our clients’ websites to have its own heatmapping and recording, along with other useful tools to get feedback on user behavior.
Personally, recordings, which are play-backs of live interactions, are my favorite part of the tool. It's anonymous, so we don't know who the users are, but they’re a great way to see if content is working or not. If there have been no conversions, recordings allow us to see if the form itself is working, or if users are experiencing frustration with it, so that we can take steps to fix functionality issues. You can also see how people move from page to page to page and whether links are working. With Hotjar, you can record an entire visitor’s experience on the page and literally see how somebody is using your website and navigating it. This can positively impact design discussions and recommendations to improve the user experience.
Any final thoughts on heatmaps?
Ines: Heatmaps are important, both after the launch of your new website and before you redesign for continuous improvement. You need to make sure your content and design works, that it’s easy to use, and that visitors are not confused. Heatmaps allow us to move from assumption-based decisions to data-driven decisions regarding website optimization. Heatmapping and visitor recordings allow us to have a more complete picture of how visitors are experiencing a website.
They also can help you make incremental ongoing improvements, especially if you are using an Agile marketing approach. They’re one of the best ways to see what improvements you should tackle next by identifying issues and prioritizing from there. You can even compare current results with old heatmaps to see how visitors used your site before improvements.
Lastly, heatmaps are very visual and easy to understand. Compared to other tools that provide a lot of tables, such as Google Analytics, heatmaps are very clear thanks to color coding, making conversations with our clients engaging and suggested improvements easier to convey.
Want to know more about how heatmap analysis can tie into your overall marketing strategy? Sign up for a complimentary Digital Marketing Assessment with our experts to learn how to make efficient data-driven decisions.